Heatmap
The Heatmap rendering transformation is a Vector-to-Raster transformation which displays a dataset as a heatmap surface (also known as a “density surface”). The heatmap surface is generated dynamically, so it can be used to visualize dynamic data. It can be applied to very large datasets with good performance.
The heatmap view is created by configuring a layer with a style which invokes the Heatmap rendering transformation.
This tutorial will show how to create a dynamic heatmap using rendering transformations.
Heatmap rendering transformation
Usage
As with all rendering transformations, the transformation is invoked by inserting a transform into a style. The style can then be applied to any layer which is backed by a suitable dataset. The dataset may have a weight attribute, whose name is supplied to the process via the weightAttr process parameter.
The transformation function is called vec:Heatmap. Note that this is the same as the WPS process, as these functions can be invoked as either a WPS process or a rendering transformation.
The transformation parameters are as follows. The order of parameters is not significant.
| Name | Required? | Description |
|---|---|---|
data |
Yes | Input FeatureCollection containing the features to transform |
radiusPixels |
Yes | Radius of the density kernel (in pixels) |
weightAttr |
No | Name of the weight attribute. (Default = 1) |
pixelsPerCell |
No | Resolution of the computed grid (Default = 1). Larger values improve performance, but may degrade appearance if too large. |
outputBBOX |
Yes | Georeferenced bounding box of the output. Not required with YSLD. |
outputWidth |
Yes | Output image width. Not required with YSLD. |
outputHeight |
Yes | Output image height. Not required with YSLD. |
Environment variables as values
It is a common situation that the output image dimensions be determined by the client at rendering time, to allow for variable window sizes.
In these cases, it is possible to read in special environment variables to the rendering transformation.
There are three environment variables that will be useful to us, which can be used as values for the following input parameters:
| Environment variable | Description | Input parameter |
|---|---|---|
wms_bbox |
WMS request extent | outputBBOX |
wms_width |
Width of resulting image | outputWidth |
wms_height |
Height of resulting image | outputHeight |
The following YSLD syntax for employing environment variables is assumed by default and need not be added to the style:
outputBBOX: ${env(wms_bbox)}
outputWidth: ${env(wms_width)}
outputHeight: ${env(wms_height)}
The following SLD syntax for employing environment variables must be explictly declared:
<ogc:Function name="parameter">
  <ogc:Literal>outputBBOX</ogc:Literal>
  <ogc:Function name="env">
    <ogc:Literal>wms_bbox</ogc:Literal>
  </ogc:Function>
</ogc:Function>

<ogc:Function name="parameter">
  <ogc:Literal>outputWidth</ogc:Literal>
  <ogc:Function name="env">
    <ogc:Literal>wms_width</ogc:Literal>
  </ogc:Function>
</ogc:Function>

<ogc:Function name="parameter">
  <ogc:Literal>outputHeight</ogc:Literal>
  <ogc:Function name="env">
    <ogc:Literal>wms_height</ogc:Literal>
  </ogc:Function>
</ogc:Function>
Input
The Heatmap rendering transformation is applied to an input dataset containing vector features. The features may be of any type, though point geometries are typically expected. If non-point geometries are used, the centroids of the features will be used. The dataset is supplied in the data parameter.
In addition, features can optionally be weighted by supplying a attribute name in the weightAttr parameter. The value of the attribute is used to weight the influence of each point feature.
Output
The output of the transformation is a single-band raster. Each pixel has a floating-point value in the range [0..1] measuring the density of the pixel relative to the rest of the surface. The generated raster can be styled using a standard raster symbolizer.
In order for the style to be correctly validated, the input geometry element must be declared in the raster symbolizer:
YSLD:
geometry: ${...}
SLD:
<Geometry>
  <ogc:PropertyName>...</ogc:PropertyName>
</Geometry>
Examples
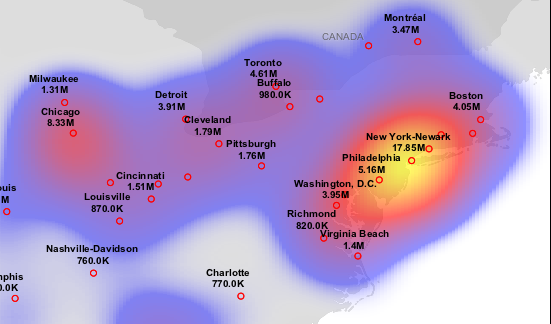
The source data used in this example is the world:cities layer (available for download on the Sample Data page).
Below are two examples showing how to perform this rendering transformation in both YSLD and SLD. You can adapt these examples to your data with minimal effort by adjusting the parameters.
YSLD
The heatmap surface, as seen in the figure at the top of the page, can be produced by the following YSLD:
1 2 3 4 5 6 7 8 9 10 11 12 13 14 15 16 17 18 19 20 | title: Heatmap
feature-styles:
- transform:
name: vec:Heatmap
params:
weightAttr: pop2000
radiusPixels: 100
pixelsPerCell: 10
rules:
- symbolizers:
- raster:
opacity: 0.6
color-map:
type: ramp
entries:
- ['#FFFFFF',0,0.0,'nodata']
- ['#FFFFFF',0,0.02,'nodata']
- ['#4444FF',1,0.1,'nodata']
- ['#FF0000',1,0.5,'values']
- ['#FFFF00',1,1.0,'values']
|
This example defines the heatmap rendering transformation giving values for the transformation parameters which are appropriate for the input dataset.
- On line 6, weightAttr specifies the dataset attribute which provides a weighting for the input points.
- On line 7, radiusPixels specifies a kernel density radius of 100 pixels.
- On line 8, pixelsPerCell defines the resolution of computation to be 10 pixels per cell, which provides efficient rendering time while still providing output of reasonable visual quality.
The raster symbolizer (starting on line 11) is used to style the raster generated by the transformation.
- On line 12, opacity specifies an overall opacity of 0.6 for the rendered layer.
- On line 13, color-map defines a color map with which to symbolize the output raster. The color map uses a type of
ramp(line 14), which produces a smooth transition between colors. The five entries (lines 16-20) between 0.0 and 0.02 are displayed with a fully transparent color of white, which makes areas where there no influence from data points invisible.
SLD
The heatmap surface can also be produced by the following SLD:
1 2 3 4 5 6 7 8 9 10 11 12 13 14 15 16 17 18 19 20 21 22 23 24 25 26 27 28 29 30 31 32 33 34 35 36 37 38 39 40 41 42 43 44 45 46 47 48 49 50 51 52 53 54 55 56 57 58 59 60 61 62 63 64 65 66 67 68 69 70 71 | <?xml version="1.0" encoding="ISO-8859-1"?>
<StyledLayerDescriptor version="1.0.0"
xsi:schemaLocation="http://www.opengis.net/sld StyledLayerDescriptor.xsd"
xmlns="http://www.opengis.net/sld"
xmlns:ogc="http://www.opengis.net/ogc"
xmlns:xlink="http://www.w3.org/1999/xlink"
xmlns:xsi="http://www.w3.org/2001/XMLSchema-instance">
<NamedLayer>
<Name>Heatmap</Name>
<UserStyle>
<Title>Heatmap</Title>
<Abstract>A heatmap surface showing population density</Abstract>
<FeatureTypeStyle>
<Transformation>
<ogc:Function name="vec:Heatmap">
<ogc:Function name="parameter">
<ogc:Literal>data</ogc:Literal>
</ogc:Function>
<ogc:Function name="parameter">
<ogc:Literal>weightAttr</ogc:Literal>
<ogc:Literal>pop2000</ogc:Literal>
</ogc:Function>
<ogc:Function name="parameter">
<ogc:Literal>radiusPixels</ogc:Literal>
<ogc:Function name="env">
<ogc:Literal>radius</ogc:Literal>
<ogc:Literal>100</ogc:Literal>
</ogc:Function>
</ogc:Function>
<ogc:Function name="parameter">
<ogc:Literal>pixelsPerCell</ogc:Literal>
<ogc:Literal>10</ogc:Literal>
</ogc:Function>
<ogc:Function name="parameter">
<ogc:Literal>outputBBOX</ogc:Literal>
<ogc:Function name="env">
<ogc:Literal>wms_bbox</ogc:Literal>
</ogc:Function>
</ogc:Function>
<ogc:Function name="parameter">
<ogc:Literal>outputWidth</ogc:Literal>
<ogc:Function name="env">
<ogc:Literal>wms_width</ogc:Literal>
</ogc:Function>
</ogc:Function>
<ogc:Function name="parameter">
<ogc:Literal>outputHeight</ogc:Literal>
<ogc:Function name="env">
<ogc:Literal>wms_height</ogc:Literal>
</ogc:Function>
</ogc:Function>
</ogc:Function>
</Transformation>
<Rule>
<RasterSymbolizer>
<!-- specify geometry attribute of input to pass validation -->
<Geometry><ogc:PropertyName>the_geom</ogc:PropertyName></Geometry>
<Opacity>0.6</Opacity>
<ColorMap type="ramp" >
<ColorMapEntry color="#FFFFFF" quantity="0" label="nodata" opacity="0"/>
<ColorMapEntry color="#FFFFFF" quantity="0.02" label="nodata" opacity="0"/>
<ColorMapEntry color="#4444FF" quantity=".1" label="nodata"/>
<ColorMapEntry color="#FF0000" quantity=".5" label="values" />
<ColorMapEntry color="#FFFF00" quantity="1.0" label="values" />
</ColorMap>
</RasterSymbolizer>
</Rule>
</FeatureTypeStyle>
</UserStyle>
</NamedLayer>
</StyledLayerDescriptor>
|
In the SLD lines 14-53 define the Heatmap rendering transformation, giving values for the transformation parameters which are appropriate for the input dataset.
- Line 17 specifies the input dataset parameter name.
- Line 21 specifies the dataset attribute which provides a weighting for the input points.
- Line 27 specifies a kernel density radius of 100 pixels.
- Line 32 defines the resolution of computation to be 10 pixels per cell, which provides efficient rendering time while still providing output of reasonable visual quality.
- Lines 34-52 define the output parameters, which are obtained from internal environment variables set during rendering, as described above.
- Lines 55-66 define the symbolizer used to style the raster computed by the transformation.
- Line 57 defines the geometry property of the input dataset, which is required for SLD validation purposes.
- Line 58 specifies an overall opacity of 0.6 for the rendered layer.
- Lines 59-65 define a color map with which to symbolize the output raster. The color map uses a type of
ramp, which produces a smooth transition between colors. Lines 60-61 specify that raster values of between 0 and 0.02 should be displayed with a fully transparent color of white, which makes areas where there no influence from data points invisible.