Styling a point layer
The populated places layer is a point layer, so we will be using point symbolizers.
Viewing the existing style
In the layers tab of Composer, click the style option for the
placeslayer to go to the style edit page. A simple default style is already associated with this layer.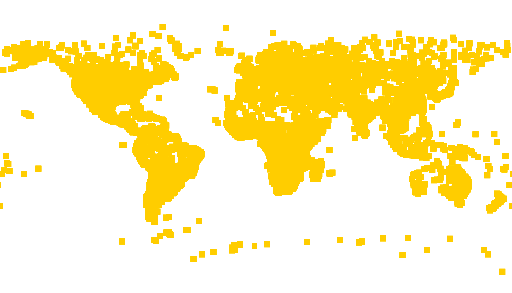
Default point style
Note
Your default color may vary.
Change the
nameandtitleto something more appropriate:name: places title: Populated places style feature-styles: - name: name rules: - symbolizers: - point: size: 6 symbols: - mark: shape: square fill-color: '#FFFF00'
Adding filters and labels
There are a lot of points in this data set, and we don’t want to draw all of them. Use the
ADM0CAPattribute and a filter to show only points that correspond to capital cities (ADM0CAP = 1):name: places title: Populated places style feature-styles: - name: name rules: - filter: ${ADM0CAP = 1} symbolizers: - point: size: 6 symbols: - mark: shape: square fill-color: '#FFCC00'
Add a text symbolizer referencing the
NAMEattribute to display the names of the cities:name: places title: Populated places style feature-styles: - name: name rules: - filter: ${ADM0CAP = 1} symbolizers: - point: size: 6 symbols: - mark: shape: square fill-color: '#FFCC00' - text: label: ${NAME}
We now have a reasonably sized set of labeled points.
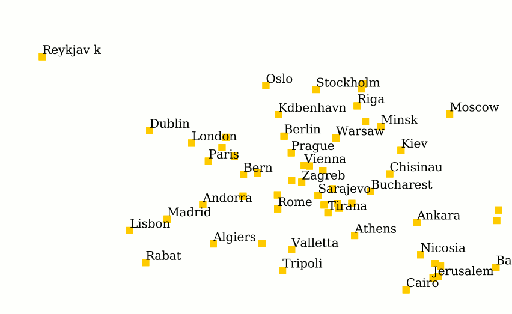
Capital cities
Refining the style
Now, lets do some styling. Point symbolizers are described by symbols, which can either be one of a predefined set of marks or an image. Marks can be styled just like polygons, with both stroke and fill.
Replace the existing point symbolizer with the following:
- point:
    size: 7
    symbols:
    - mark:
        shape: star
        fill-color: '#000000'
This draws a black star 7 pixels in height.
Create a second point symbolizer with the following:
- point:
    size: 8
    symbols:
    - mark:
        shape: circle
        stroke-color: '#000000'
This draws the outline of a black circle, 8 pixels in diameter.
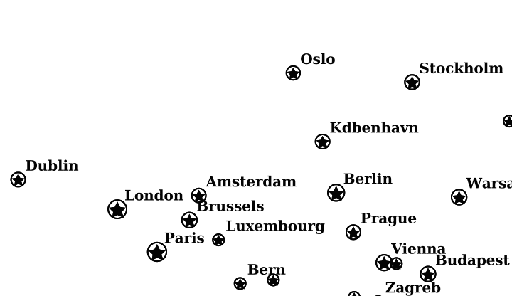
Modify the text symbolizer to improve the display of the labels:
Parameter Description font-weight: boldMake the font bold displacement: [3,2]Adjusts the label so it does not overlap the point symbolizer x-labelPriority: ${10-LABELRANK}Select labels based on priority (uses the LABELRANKattribute of the data to determine this).The full style is now:
name: places
title: Populated places style
feature-styles:
- name: name
  rules:
  - filter: ${ADM0CAP = 1}
    symbolizers:
    - point:
        size: 7
        symbols:
        - mark:
            shape: star
            fill-color: '#000000'
    - point:
        size: 8
        symbols:
        - mark:
            shape: circle
            stroke-color: '#000000'
    - text:
        label: ${NAME}
        font-weight: bold
        displacement: [3,2]
        x-labelPriority: ${10-LABELRANK}
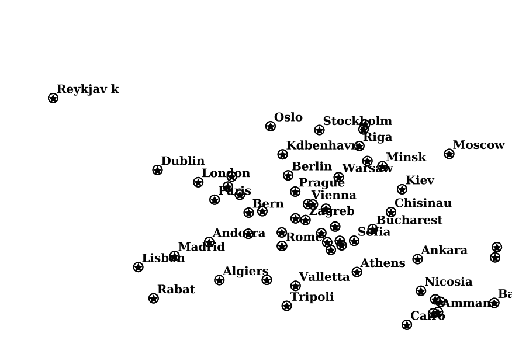
Capital cities with labels
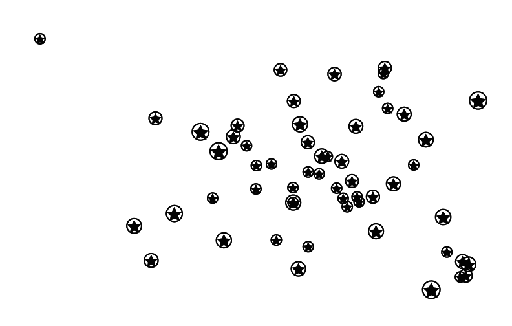
Since this data set contains population attributes, we can scale the size of the points based on population. Use
${log(POP_MAX)/log(4)}in thesizeparameter to get a relative scale without too much variation in point size. As before, make the circle symbolizer one pixel larger than the star:name: places title: Populated places style feature-styles: - name: name rules: - filter: ${ADM0CAP = 1} symbolizers: - point: size: ${log(POP_MAX)/log(4)} symbols: - mark: shape: star fill-color: '#000000' - point: size: ${log(POP_MAX)/log(4)+1} symbols: - mark: shape: circle stroke-color: '#000000' - text: label: ${NAME} font-weight: bold displacement: [5,4] x-labelPriority: ${10-LABELRANK}
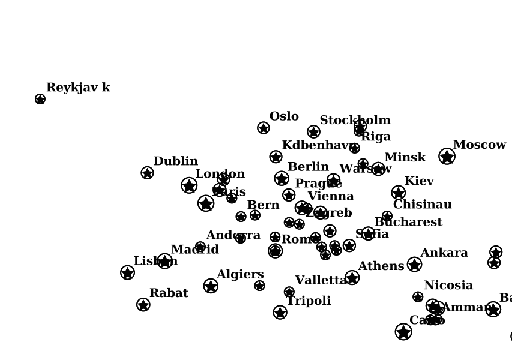
Variable symbol sizes
Adding scale
To improve the display further, we can add scale rules.
Split the single rule into three rules:
- A 3 pixel black circle for the features when zoomed out past 100,000,000 (
1e8). - The star/circle combo as done in the previous section when zoomed in past 100,000,000 (
1e8). - The labels only when zoomed in past 50,000,000 (
5e7).
This results in the following style:
name: places
title: Populated places style
feature-styles:
- name: name
  rules:
  - scale: [1e8,max]
    filter: ${ADM0CAP = 1}
    symbolizers:
    - point:
        size: 3
        symbols:
        - mark:
            shape: circle
            fill-color: '#000000'
  - scale: [min,1e8]
    filter: ${ADM0CAP = 1}
    symbolizers:
    - point:
        size: ${log(POP_MAX)/log(4)}
        symbols:
        - mark:
            shape: star
            fill-color: '#000000'
    - point:
        size: ${log(POP_MAX)/log(4)+1}
        symbols:
        - mark:
            shape: circle
            stroke-color: '#000000'
  - scale: [min,5e7]
    filter: ${ADM0CAP = 1}
    symbolizers:
    - text:
        label: ${NAME}
        font-weight: bold
        displacement: [5,4]
        x-labelPriority: ${10-LABELRANK}
- A 3 pixel black circle for the features when zoomed out past 100,000,000 (
We can show all the cities that are currently hidden when we zoom in further. One way to do this is by adding rules with an
elseclause and small scales. As with the capital cities, we will selectively show labels depending on the scale. To do this: add these two rules to the bottom of the style:- scale: [5e6,1e7] else: true symbolizers: - point: size: ${log(POP_MAX)/log(4)} symbols: - mark: shape: circle stroke-color: '#000000' fill-color: '#777777' fill-opacity: 0.5 - scale: [min,5e6] else: true symbolizers: - point: size: ${log(POP_MAX)/log(4)+1} symbols: - mark: shape: circle stroke-color: '#000000' fill-color: '#777777' fill-opacity: 0.5 - text: label: ${NAME} displacement: [5,4] x-labelPriority: ${10-LABELRANK}
Final style
The full style is now:
name: places
title: Populated places style
feature-styles:
- name: name
rules:
- scale: [1e8,max]
filter: ${ADM0CAP = 1}
symbolizers:
- point:
size: 3
symbols:
- mark:
shape: circle
fill-color: '#000000'
- scale: [min,1e8]
filter: ${ADM0CAP = 1}
symbolizers:
- point:
size: ${log(POP_MAX)/log(4)}
symbols:
- mark:
shape: star
fill-color: '#000000'
- point:
size: ${log(POP_MAX)/log(4)+1}
symbols:
- mark:
shape: circle
stroke-color: '#000000'
- scale: [min,5e7]
filter: ${ADM0CAP = 1}
symbolizers:
- text:
label: ${NAME}
font-weight: bold
displacement: [5,4]
x-labelPriority: ${10-LABELRANK}
- scale: [5e6,1e7]
  else: true
  symbolizers:
    - point:
        size: ${log(POP_MAX)/log(4)}
        symbols:
        - mark:
            shape: circle
            stroke-color: '#000000'
            fill-color: '#777777'
            fill-opacity: 0.5
- scale: [min,5e6]
  else: true
  symbolizers:
    - point:
        size: ${log(POP_MAX)/log(4)+1}
        symbols:
        - mark:
            shape: circle
            stroke-color: '#000000'
            fill-color: '#777777'
            fill-opacity: 0.5
    - text:
        label: ${NAME}
        displacement: [5,4]
        x-labelPriority: ${10-LABELRANK}
After these modifications, we have a much nicer display at different zoom levels:
Cities (zoomed out)
Cities (intermediate zoom)
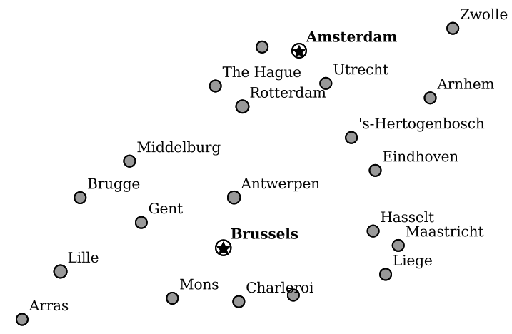
Cities (zoomed in)
Continue on to Styling a raster layer.