Styling a raster layer
Raster layers are composed of a grid of values in one or more bands. A grayscale image will have a single band, with each grid element containing the intensity at that pixel. An RGB image will have 3 bands, corresponding to red, green, and blue values. A raster can have any number of bands.
This raster layer has a single band. With the default raster symbolizer, it is drawn as a grayscale image.
Viewing the existing style
In the layers tab of Composer, click the style option for the
demlayer to go to the style edit page. A simple default style is already associated with this layer:name: raster feature-styles: - name: name rules: - symbolizers: - raster: opacity: 1
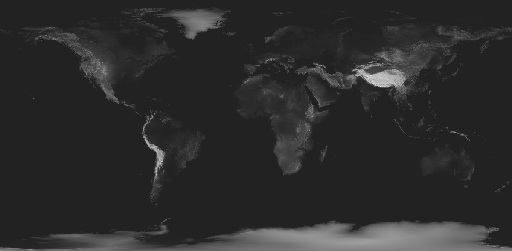
Default raster display
Adding contrast
If we want the land to show up better in the display, we can use the
contrast-enhancementattribute:name: raster feature-styles: - name: name rules: - symbolizers: - raster: opacity: 1 contrast-enhancement: mode: histogram gamma: 4
This adjusts the contrast so each brightness level contains an equal amount of content, and darkens the resulting image by a factor of
4.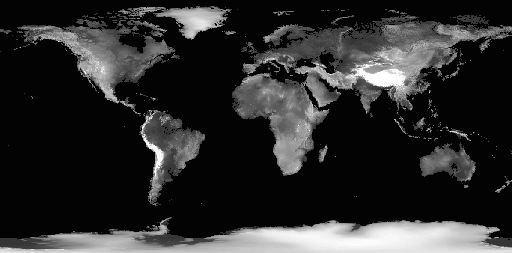
Added contrast
Creating a color map
The color-map attribute can be used to convert any single band of data into a colored image based on the band values.
Since
contrast-enhancementcannot be used withcolor-map, remove it from the style. Replace it with a color map with the following intervals:Color Values '#0043C8'Less than 8080'#00C819'Between 8080and100000color-map: type: intervals entries: - ['#0043C8', 1, 8080, blue] - ['#00C819', 1, 100000, green]
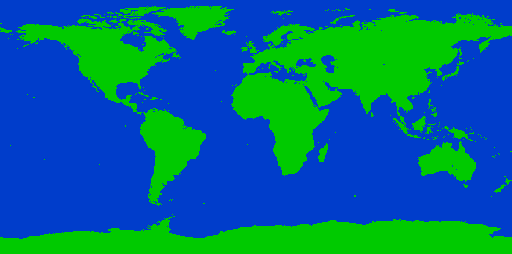
Interval color map
The color map can also be used with
type: rampto create a gradient of colors between entries. Use this to create a basic colored elevation map with entries denoting ocean and four elevations:Color Value '#0043C8'(ocean)Less than 8080'#3A3519'(shore)Between 8080and8100'#4B4422'(low elevation)Between 8080and10000'#857B54'(mid elevation)Between 10000and15000'#D9D1A8'(red)Between 15000and30000color-map: type: ramp entries: - ['#0043C8', 1, 8080, ocean] - ['#3A3519', 1, 8100, shore] - ['#4B4422', 1, 10000, low] - ['#857B54', 1, 20000, mid] - ['#D9D1A8', 1, 60000, high]
Final style
The final style looks like:
name: raster
feature-styles:
- name: name
  rules:
  - symbolizers:
    - raster:
        opacity: 1
color-map:
  type: ramp
  entries:
  - ['#0043C8', 1, 8080, ocean]
  - ['#3A3519', 1, 8100, shore]
  - ['#4B4422', 1, 10000, low]
  - ['#857B54', 1, 20000, mid]
  - ['#D9D1A8', 1, 60000, high]
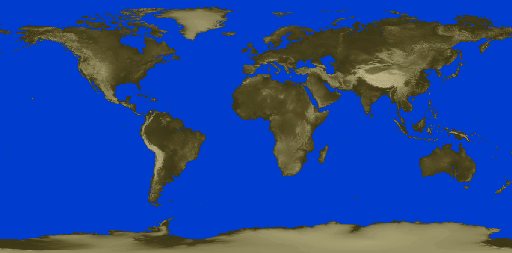
Simplified color map
We have now styled all of our layers. Continue on to Composing a map for the final step in the process.