Creating a static contour map
Using the GeoServer WPS process ras:Contour, it is possible to generate a vector contour layer of a given raster layer.
Running the process
There are two ways to execute a process:
- Through WPS Builder
- Through the WPS Request Builder demo in GeoServer
The two sections below result in the same output.
Using WPS Builder
Open WPS Builder.
Note
If GeoServer is at
http://localhost:8080/geoserver, then WPS Builder will be athttp://localhost:8080/wpsbuilder.Drag the Contour process (under Raster) onto the Canvas.
Click each parameter to set the input values. Use the following:
Field Value Example data Name of the raster layer or the source of the data Name of the layer (such as opengeo:rainier)interval Interval between contour lines 100simplify Whether to reduce the vertices in the output True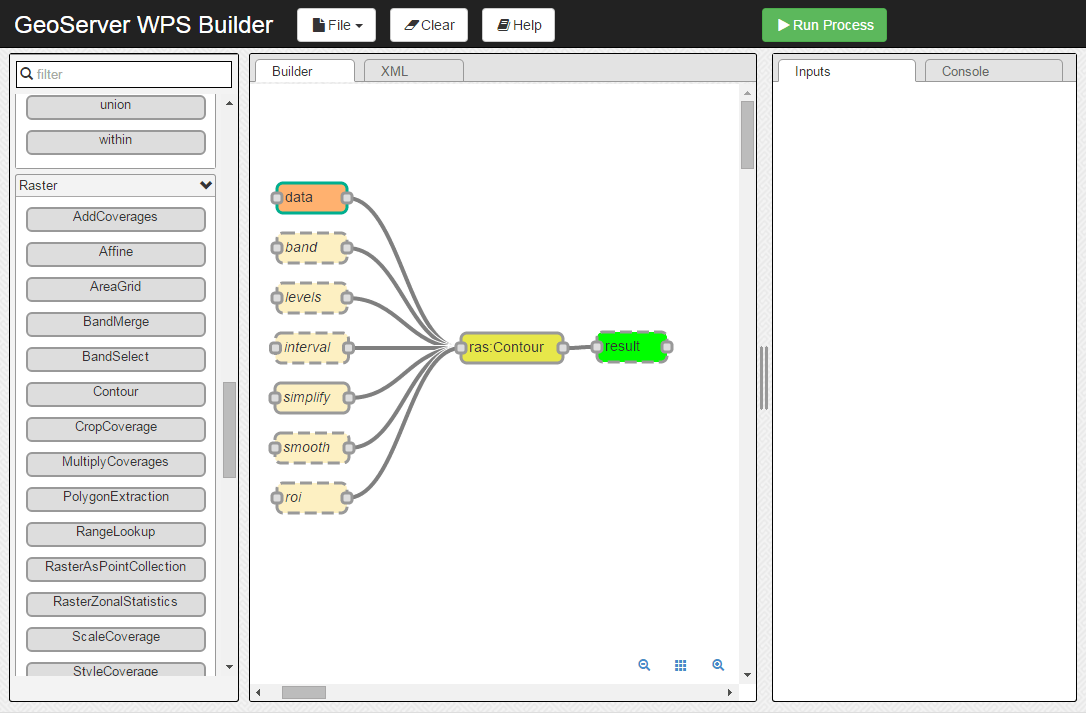
Contour process in WPS Builder
Click Run Process.
Click Download to save the output.
Using the WPS Request Builder
Open the WPS Request Builder by going to Demos in GeoServer and selecting WPS Request Builder.
Once there, select ras:Contour in the box marked Choose process.
Enter the following information for your specific data:
Field Value Example data Name of the raster layer or the source of the data Name of the layer (such as opengeo:rainier)band Name of the band used for the contour values GRAY_INDEXinterval Interval between contour lines 100simplify Whether to reduce the vertices in the output trueresult Output format application/zip(for Shapefile)All other fields can be left blank.
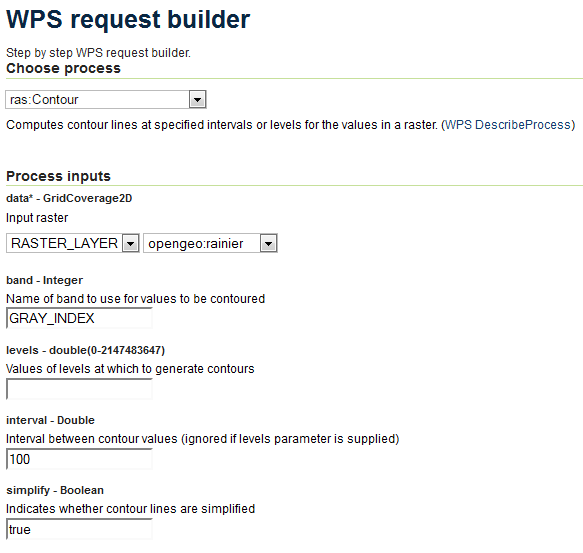
WPS Request Builder for creating a contour layer
Run this process, and save the resulting archive.
Loading output
One the output of the process has been downloaded, it needs to be added back to GeoServer.
Import the output back into GeoServer, using either Composer or the Layer Importer.
Note
It is also possible to chain the output of this process to the input of the gs:Import process. This way, the GeoServer layer will be published in one step without the need for a shapefile to be created.
View this layer using Composer or GeoExplorer. When making the map, place the contour layer on top of the source raster layer for proper context.
Note
See the Composer tutorial for how to create a map with multiple layers.
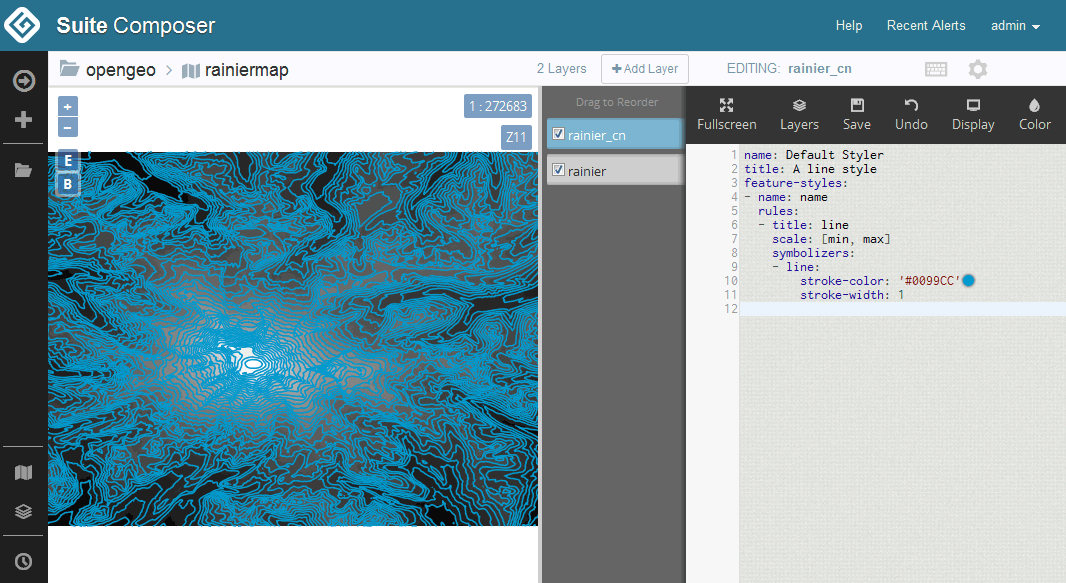
Simple generated contour map viewed in Composer
Styling
Initial improvement
The default style created by GeoServer can be improved based on the Design considerations of a topographic map.
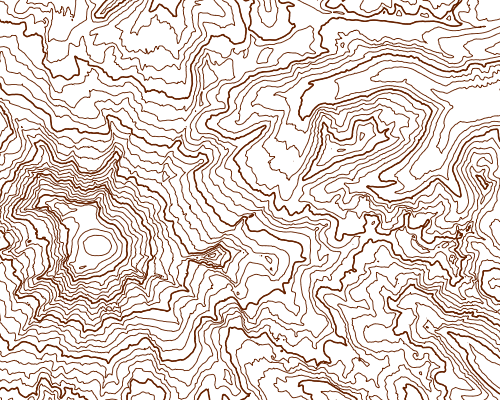
First, the default display can be improved by setting up a rule with a thinner line.
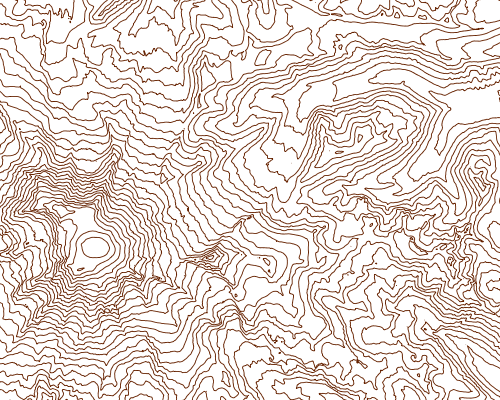
Map with a single style
Using Composer, the YSLD will look like this:
feature-styles:
- rules:
  - name: rule 1
    title: Contour Line (100)
    symbolizers:
    - line:
        stroke-color: '#662200'
        stroke-width: 0.4
The equivalent SLD will look like this:
<?xml version="1.0" encoding="ISO-8859-1"?>
<StyledLayerDescriptor version="1.0.0"
  xsi:schemaLocation="http://www.opengis.net/sld StyledLayerDescriptor.xsd"
  xmlns="http://www.opengis.net/sld"
  xmlns:ogc="http://www.opengis.net/ogc"
  xmlns:xlink="http://www.w3.org/1999/xlink"
  xmlns:xsi="http://www.w3.org/2001/XMLSchema-instance">
  <NamedLayer>
    <Name>contour</Name>
    <UserStyle>
      <Title>Contour</Title>
      <Abstract>Contour map</Abstract>
      <FeatureTypeStyle>
        <Rule>
          <Name>rule 1</Name>
          <Title>Contour Line (100)</Title>
          <LineSymbolizer>
            <Stroke>
              <CssParameter name="stroke">#662200</CssParameter>
              <CssParameter name="stroke-width">0.4</CssParameter>
            </Stroke>
          </LineSymbolizer>
        </Rule>
      </FeatureTypeStyle>
    </UserStyle>
  </NamedLayer>
</StyledLayerDescriptor>
Differing widths
Too many lines of equal width can make them hard to distinguish, so the next step is to add a rule that will display every fifth band (500 meters) as thicker (1px instead of 0.4px). You can determine if the value of the band is a multiple of 500 by using the IEEERemainder filter function.
Note
Read more about filtering in GeoServer.
Map style with two different band thicknesses
YSLD:
  - name: rule 2
    title: Contour Line (500)
    filter: ${IEEEremainder(int2ddouble(value),parseDouble('500.0')) = '0'}
    symbolizers:
    - line:
        stroke-color: '#662200'
        stroke-width: 1
SLD:
        <Rule>
          <Name>rule 2</Name>
          <Title>Contour Line (500)</Title>
          <ogc:Filter>
            <ogc:PropertyIsEqualTo>
              <ogc:Function name="IEEERemainder">
                <ogc:Function name="int2ddouble">
                <ogc:PropertyName>value</ogc:PropertyName>
                </ogc:Function>
                <ogc:Function name="parseDouble">
                  <ogc:Literal>500.0</ogc:Literal>
                </ogc:Function>
              </ogc:Function>
              <ogc:Literal>0</ogc:Literal>
            </ogc:PropertyIsEqualTo>
          </ogc:Filter>
          <LineSymbolizer>
            <Stroke>
              <CssParameter name="stroke">#662200</CssParameter>
              <CssParameter name="stroke-width">1</CssParameter>
            </Stroke>
          </LineSymbolizer>
        </Rule>
Scale-based style
The differing thicknesses is an improvement, but when zoomed out there still will be too many thin lines rendered. So we will add a scale rule to the first rule to prevent the thin lines from showing up when the map is zoomed out too far.
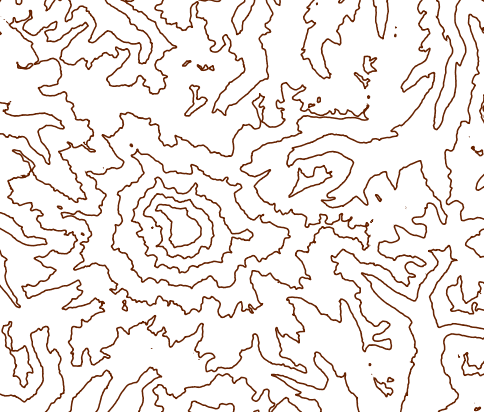
Map style hiding thin bands when zoomed out
YSLD:
  - name: rule 1
    title: Contour Line (100)
    scale: [min, 250000]
    symbolizers:
    - line:
        stroke-color: '#662200'
        stroke-width: 0.4
SLD:
        <Rule>
          <Name>rule 1</Name>
          <Title>Contour Line (100)</Title>
          <MaxScaleDenominator>250000</MaxScaleDenominator>
          <LineSymbolizer>
            <Stroke>
              <CssParameter name="stroke">#662200</CssParameter>
              <CssParameter name="stroke-width">0.4</CssParameter>
            </Stroke>
          </LineSymbolizer>
        </Rule>
Labels
A good topographic map should have labels for the bands. Since there are two rules for bands, two similar rules for labels will be created as well: one for the thin lines and one for the thick lines. The primary difference between the two rules will be the font weight: bold to match the thicker lines, normal weight to match the thinner lines. The bold labels will also be prioritized higher.
Add these rules to the bottom of the existing style created above:
For the thinner lines:
YSLD:
  - name: rule 3
    title: Label (100)
    scale: [min, 250000]
    symbolizers:
    - text:
        label: ${round(value)}
        priority: 2000
        fill-color: '#662200'
        halo:
          fill-color: '#FFFFFF'
          fill-opacity: 0.6
          radius: 2
        font-family: Arial
        font-size: 10
        font-style: normal
        font-weight: Normal
        placement: line
        offset: 0.0
        x-followLine: true
        x-repeat: 300
        x-maxDisplacement: 50
        x-maxAngleDelta: 30
        x-spaceAround: 20
SLD:
        <Rule>
          <Name>rule 3</Name>
          <Title>Label (100)</Title>
          <MaxScaleDenominator>250000</MaxScaleDenominator>
          <TextSymbolizer>
            <Label>
              <ogc:Function name="round">
                <ogc:PropertyName>value</ogc:PropertyName>
              </ogc:Function>
            </Label>
            <Font>
              <CssParameter name="font-family">Arial</CssParameter>
              <CssParameter name="font-weight">Normal</CssParameter>
              <CssParameter name="font-size">10</CssParameter>
            </Font>
            <LabelPlacement>
              <LinePlacement/>
            </LabelPlacement>
            <Halo>
              <Radius>
                <ogc:Literal>2</ogc:Literal>
              </Radius>
              <Fill>
                <CssParameter name="fill">#FFFFFF</CssParameter>
                <CssParameter name="fill-opacity">0.6</CssParameter>
              </Fill>
            </Halo>
            <Fill>
              <CssParameter name="fill">#662200</CssParameter>
            </Fill>
            <Priority>2000</Priority>
            <VendorOption name="followLine">true</VendorOption>
            <VendorOption name="repeat">300</VendorOption>
            <VendorOption name="maxDisplacement">50</VendorOption>
            <VendorOption name="maxAngleDelta">30</VendorOption>
            <VendorOption name="spaceAround">20</VendorOption>
          </TextSymbolizer>
        </Rule>
Label rule for the thicker lines:
YSLD:
  - name: rule 4
    title: Label (500)
    filter: ${IEEEremainder(int2ddouble(value),parseDouble('500.0')) = '0'}
    scale: [min, max]
    symbolizers:
    - text:
        label: ${round(value)}
        priority: 3000
        fill-color: '#662200'
        halo:
          fill-color: '#FFFFFF'
          fill-opacity: 0.6
          radius: 2
        font-family: Arial
        font-size: 10
        font-style: normal
        font-weight: Bold
        placement: line
        offset: 0.0
        x-followLine: true
        x-repeat: 300
        x-maxDisplacement: 50
        x-maxAngleDelta: 30
        x-spaceAround: 20
        <Rule>
          <Name>rule 4</Name>
          <Title>Label (500)</Title>
          <ogc:Filter>
            <ogc:PropertyIsEqualTo>
              <ogc:Function name="IEEERemainder">
                <ogc:Function name="int2ddouble">
                <ogc:PropertyName>value</ogc:PropertyName>
                </ogc:Function>
                <ogc:Function name="parseDouble">
                  <ogc:Literal>500.0</ogc:Literal>
                </ogc:Function>
              </ogc:Function>
              <ogc:Literal>0</ogc:Literal>
            </ogc:PropertyIsEqualTo>
          </ogc:Filter>
          <TextSymbolizer>
            <Label>
              <ogc:Function name="round">
                <ogc:PropertyName>value</ogc:PropertyName>
              </ogc:Function>
            </Label>
            <Font>
              <CssParameter name="font-family">Arial</CssParameter>
              <CssParameter name="font-weight">Bold</CssParameter>
              <CssParameter name="font-size">10</CssParameter>
            </Font>
            <LabelPlacement>
              <LinePlacement/>
            </LabelPlacement>
            <Halo>
              <Radius>
                <ogc:Literal>2</ogc:Literal>
              </Radius>
              <Fill>
                <CssParameter name="fill">#FFFFFF</CssParameter>
                <CssParameter name="fill-opacity">0.6</CssParameter>
              </Fill>
            </Halo>
            <Fill>
              <CssParameter name="fill">#662200</CssParameter>
            </Fill>
            <Priority>3000</Priority>
            <VendorOption name="followLine">true</VendorOption>
            <VendorOption name="repeat">300</VendorOption>
            <VendorOption name="maxDisplacement">50</VendorOption>
            <VendorOption name="maxAngleDelta">30</VendorOption>
            <VendorOption name="spaceAround">20</VendorOption>
          </TextSymbolizer>
        </Rule>
Putting it all together looks like this:
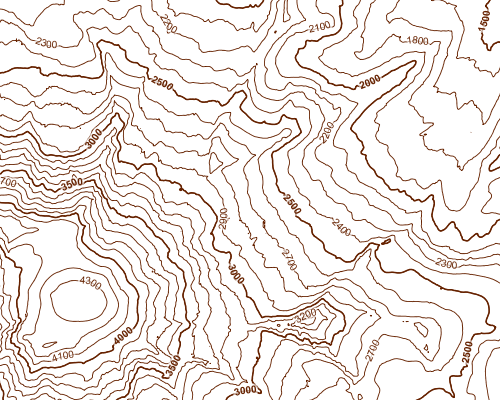
Finished map style
Download the full YSLD for this example (and the SLD)
Viewing
Using Composer, load this style into the layer on the style/view page for that layer, and click Save.
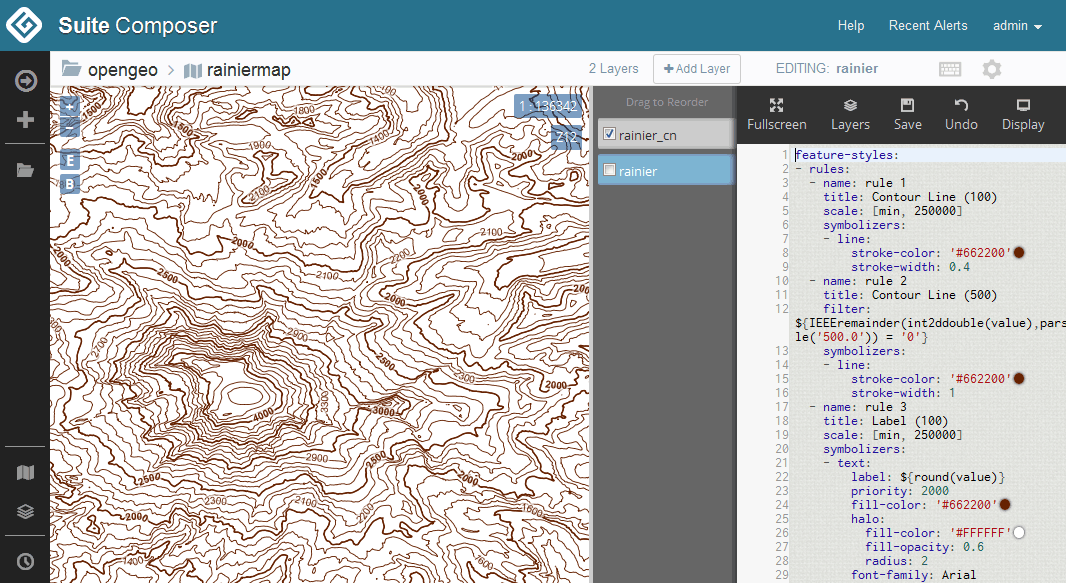
Static contour map in Composer
Note
If not using Composer, load the SLD into GeoServer via the Styles menu and select Add new style.
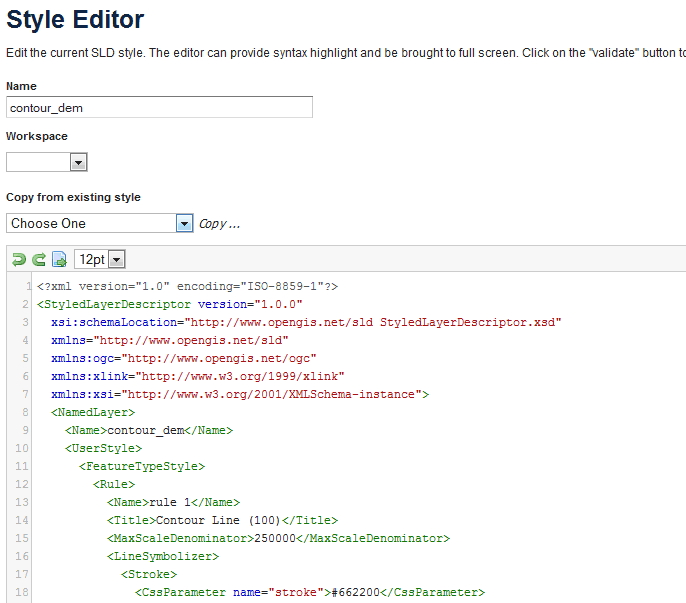
Creating a new style
Once that is done, associate this style with the original layer. You can do this by going to the Layers menu, clicking on the layer name, clicking on the Publishing tab, and selecting the style from the drop-down menu called Default style. Click Save when done.
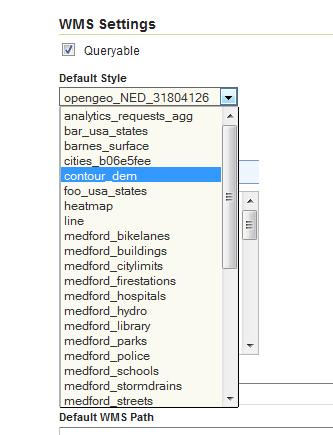
Associating the style with the layer
Once these changes are saved, go to the Layer Preview and view the layer. You can also view the layer in GeoExplorer.
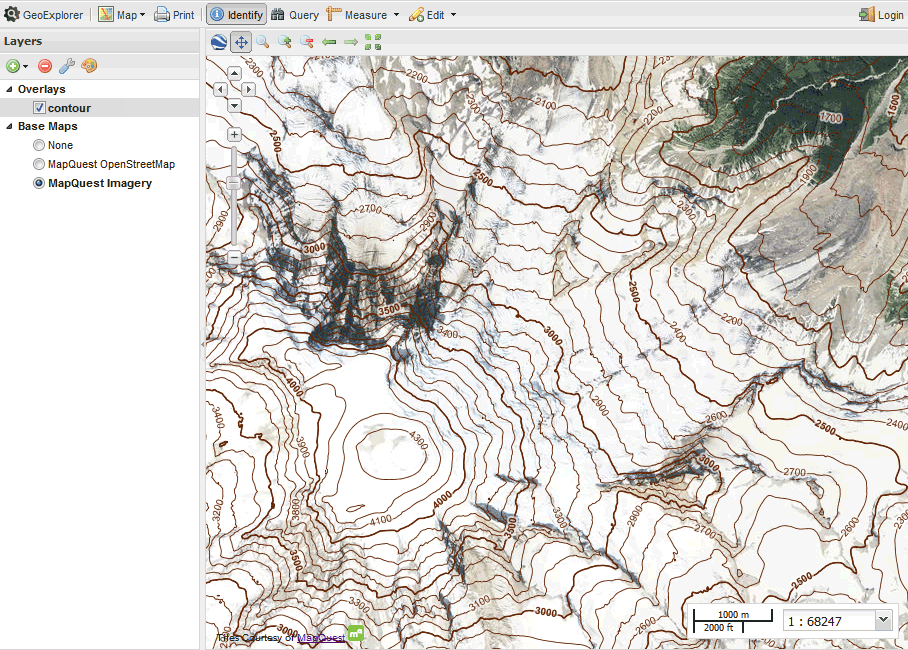
Static contour map in GeoExplorer
In the next section, the contour map will be generated dynamically from the source raster.