Mapping songs about Madrid
This tutorial shows how to create a web app that explores songs related to the city of Madrid in Spain. For each song, an entry is added to a map, which contains information abut the lyrics and the author. A popup is shown when hovering over each song point, with an embeded video for the song. This app is inspired by a similar work published in this article in the Huffington Post.
Data
Download the data for this tutorial.
This archive contains a point shapefile with song information, along with an icon that we will use to render song locations on the map.
Preparing the application in QGIS
First, we have to set up our data layers in QGIS.
Add the vector layer to a QGIS project.
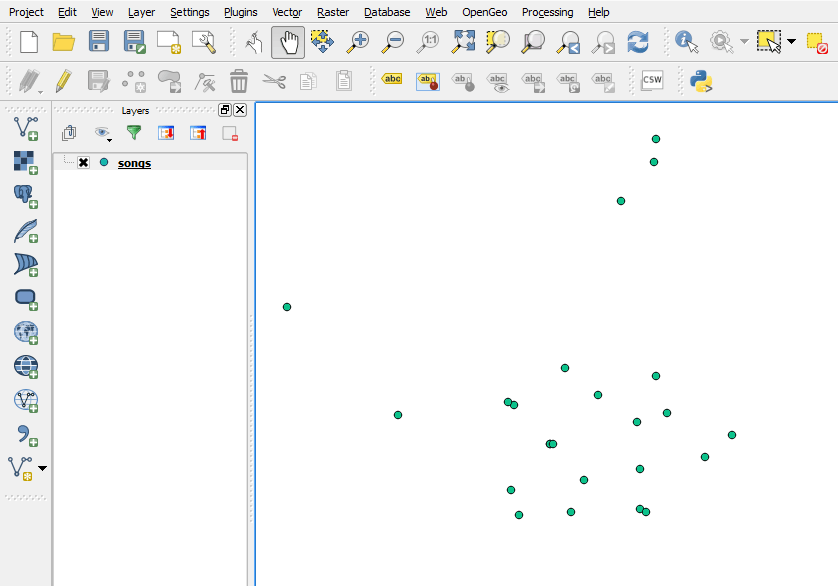
Layer with default style
Improve the default styling by replacing the default symbol with the SVG marker included in the data. (
note.svg). This can be done in the Layer Properties interface (found by right-clicking the layer name and going to Properties.)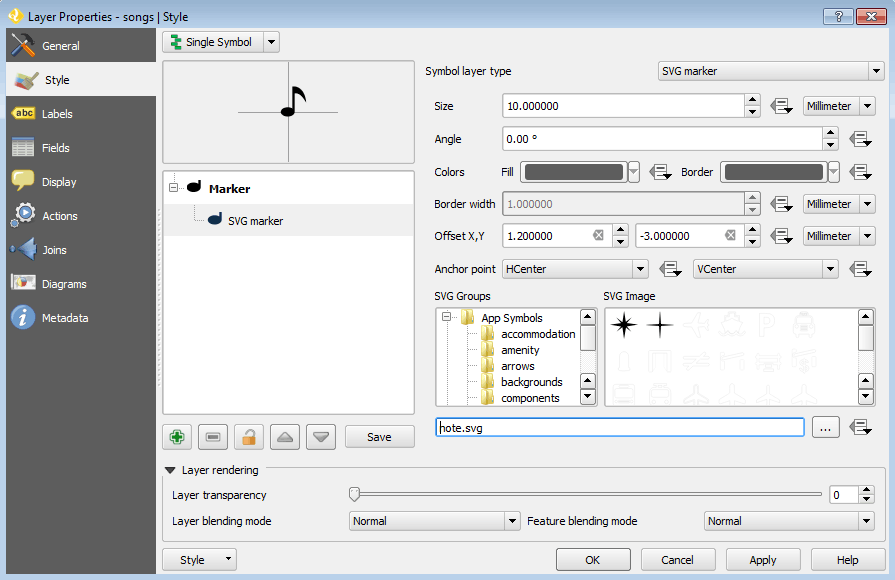
Adding styling
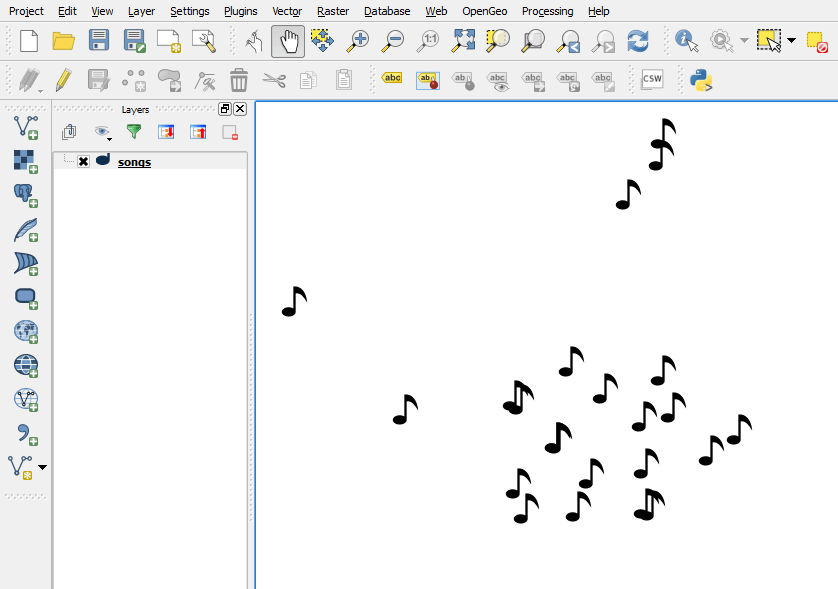
Layer with SVG marker
Configuring the application
Start the Web App Builder by selecting . This will bring up the interface used to configure our web app. There are several tabs, each one used to define a particular set of parameters. We will go through each of them and describe their meaning.
In the Description tab, fill out the form with the following:
Enter
Mapping Madrid songsin the title box.Select the fullscreen theme.
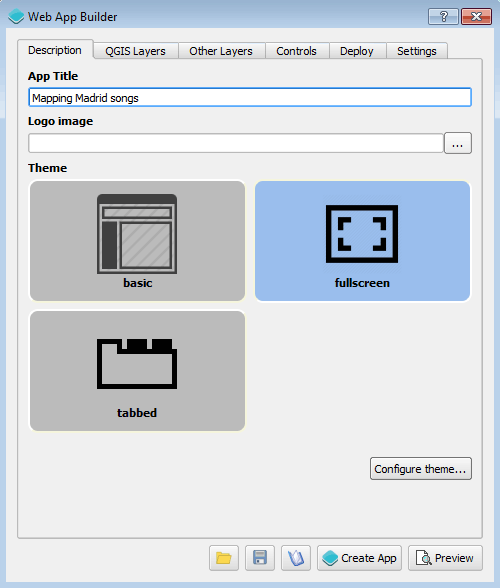
Description tab
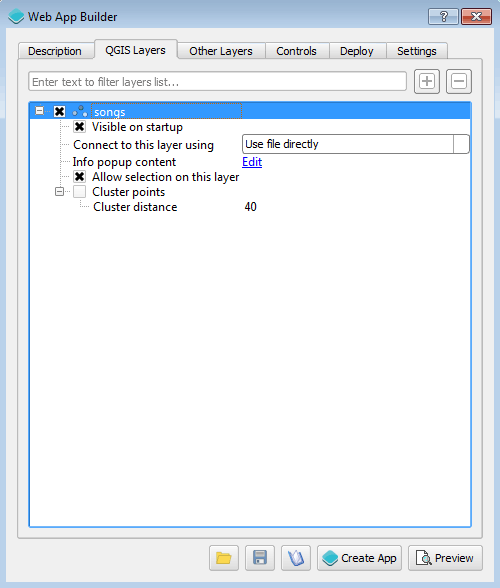
In the QGIS Layers tab, fill out the form with the following:
Make sure that the Songs layer is checked.
Click the Edit link to edit the content of the popup for the layer.
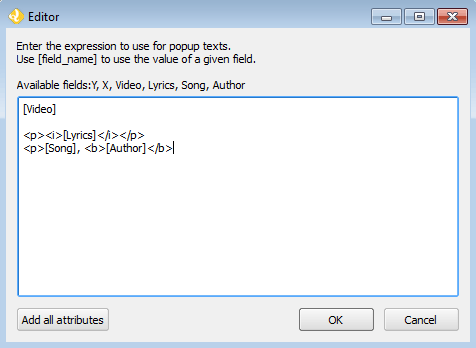
Enter the following in the text box to define the content of the popup:
[Video]

<p><i>[Lyrics]</i></p>
<p>[Song], <b>[Author]</b>
This popup will display the embeded video as well as lyrics, song, and author information.
Feature popup
Click OK.
In the Other Layers tab, select the Stamen toner lite layer.
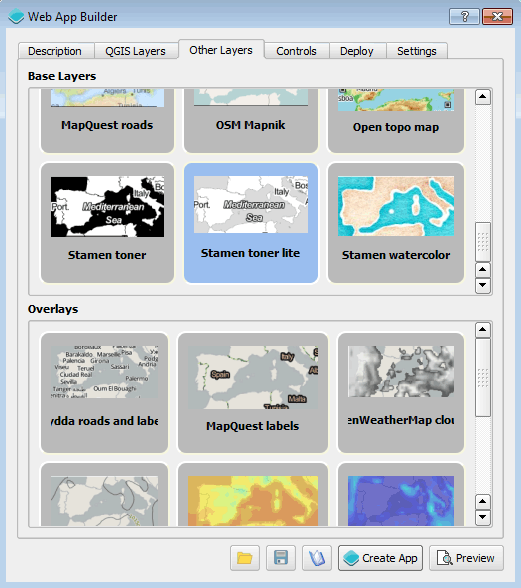
Other Layers tab
In the Controls tab, disable (unselect) all controls.
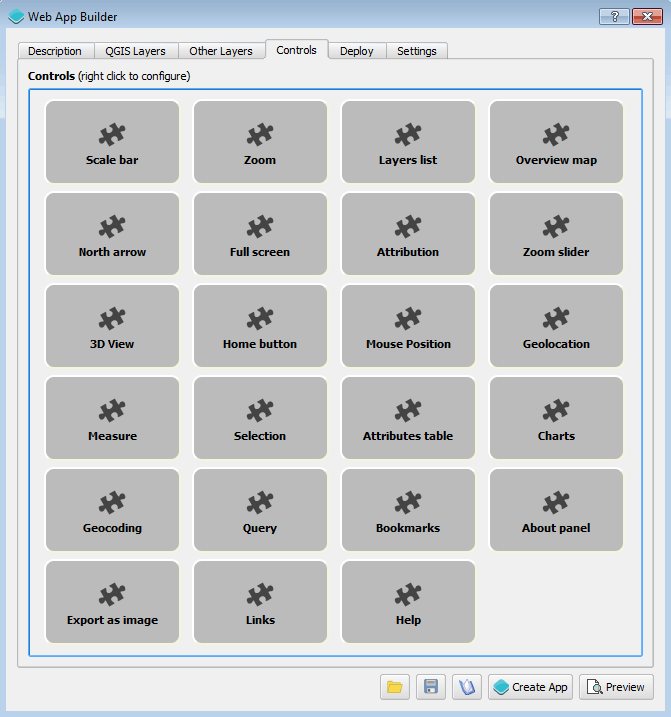
Controls tab
In the Settings tab, check the Show popups on hover parameter, so popups are shown when passing the mouse over the points without having to click on them.
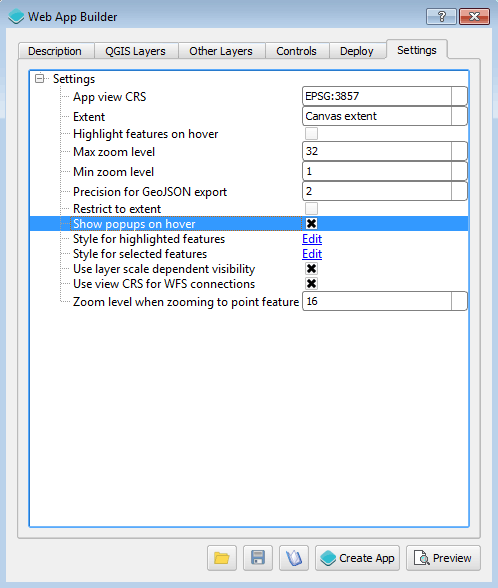
Settings tab
Note
There is no need to edit any of the parameters in the Deploy tab.
Creating the application
Save the application configuration by clicking the Save (disk) icon at the bottom of the dialog.
With the configuration defined, we can now create it by clicking the Create App button at the bottom of the Web App Builder dialog.
Select the directory where you want to store the web app.
The app will be created and saved in this directory. When finished, a dialog will display.
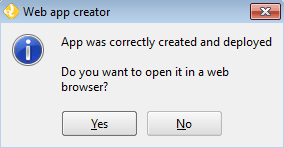
App successfully deployed
Click Yes to see the deployed app.
Final result
If not already open, launch the app by opening index.html file inside the directory where you created your web app.
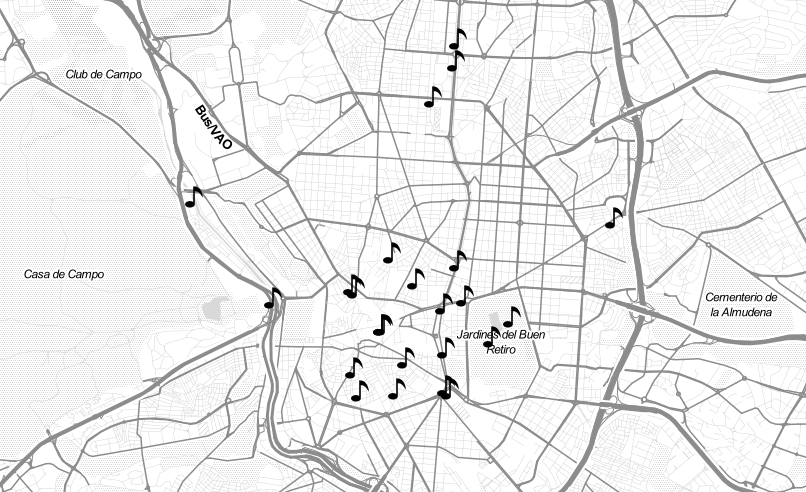
Deployed app
To see the application in action, hover over any of the points on the map.
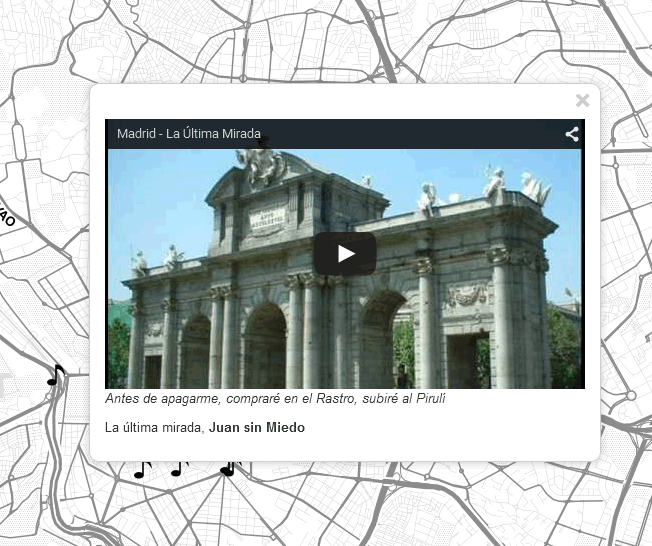
Hovering over a point